Presentation Tip: Proportional Object Collection Calculator
Earlier this year I created an online tool to calculate the sizes of two shapes based on values that you input. This allows you to create a diagram with two proportional shapes. I wrote about this calculator in the June 11 issue of the newsletter and gave examples of the background and other links about this type of diagram. At the Presentation Summit in September, fellow PowerPoint MVP Glenna Shaw of visualology.net suggested that what I had created was good, but needed to go further.
Glenna had written about the online tool in blog posts for Microsoft (see the June 11 newsletter for links), but she wanted it to do more. She wanted the tool to calculate the sizes of more than two shapes. This would allow it to be used when you have more than two values to compare visually. She also wanted it to be more generic, so the sizes could apply to any shape or image, not just squares, rectangles, and circles.
Of course her ideas made perfect sense. So I went to work in my hotel room that day and created a new tool, the Proportional Object Collection Calculator. It allows you to create slides like this:
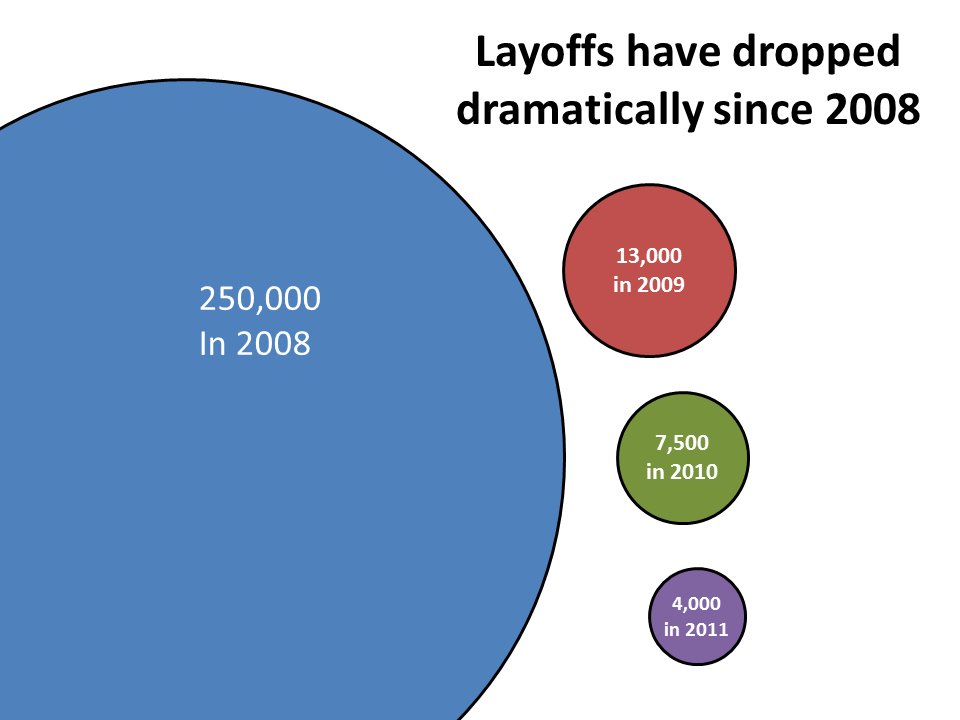
This example of a proportional object collection shows one of the shapes only partially on the slide. When one of the values is much larger than the rest of the values, this approach can work well because it allows the shapes for the smaller values to be more easily seen on the slide. The audience still understands the magnitude of the large shape because more than half of it is on the slide.
To use the calculator, enter the height and width of the largest object you want to create (in inches or centimetres). Then you enter the values you want to represent with proportional objects. Enter the values in order from largest to smallest. In the Results section, you will see exact measurements for each object. Use the entry fields in the Size group for the object to enter the height and width shown in the Results table.
I have found it easiest to copy the results table of object sizes onto my slide so it is easy to see when entering the sizes for each shape or image. You can make the table smaller if it is taking up too much room, and move it to one of the top corners of the slide so it is out of the way of where you are placing the objects. When you are done, you can delete the table or move it to the Notes section of the slide if you need to keep the dimensions of the objects.
Instead of a column or bar graph, consider using a proportional object collection in your next presentation. It tells the story of the numbers visually in a way the audience will understand and remember.
Glenna had written about the online tool in blog posts for Microsoft (see the June 11 newsletter for links), but she wanted it to do more. She wanted the tool to calculate the sizes of more than two shapes. This would allow it to be used when you have more than two values to compare visually. She also wanted it to be more generic, so the sizes could apply to any shape or image, not just squares, rectangles, and circles.
Of course her ideas made perfect sense. So I went to work in my hotel room that day and created a new tool, the Proportional Object Collection Calculator. It allows you to create slides like this:
This example of a proportional object collection shows one of the shapes only partially on the slide. When one of the values is much larger than the rest of the values, this approach can work well because it allows the shapes for the smaller values to be more easily seen on the slide. The audience still understands the magnitude of the large shape because more than half of it is on the slide.
To use the calculator, enter the height and width of the largest object you want to create (in inches or centimetres). Then you enter the values you want to represent with proportional objects. Enter the values in order from largest to smallest. In the Results section, you will see exact measurements for each object. Use the entry fields in the Size group for the object to enter the height and width shown in the Results table.
I have found it easiest to copy the results table of object sizes onto my slide so it is easy to see when entering the sizes for each shape or image. You can make the table smaller if it is taking up too much room, and move it to one of the top corners of the slide so it is out of the way of where you are placing the objects. When you are done, you can delete the table or move it to the Notes section of the slide if you need to keep the dimensions of the objects.
Instead of a column or bar graph, consider using a proportional object collection in your next presentation. It tells the story of the numbers visually in a way the audience will understand and remember.
posted by Unknown at 4:45 PM
3 comments
![]()


