April 10 workshop in Toronto on turning Excel data into visuals for executive presentations
Professionals who present financial or operational data say there are two key roadblocks to them using effective visuals instead of the spreadsheets, tables, and complex graphs they are currently using. First, they need to know what visuals work for the different messages they deliver. Second, they need to know how to create these visuals in PowerPoint.
My workshop on April 10 in downtown Toronto will show you how to overcome these roadblocks. You will see many different visuals from real presentations, and you will be hands-on in PowerPoint practicing the techniques that are used to create the visuals. The full details of all you will learn are on my website at www.MakeNumbersVisual.com.
Who should attend this workshop? Anyone who: 1) has to present financial or operational data in their presentations, 2) knows that there must be a better way than using spreadsheets on slides, and 3) is willing to learn new visuals that are more effective.
If you are in the Toronto area, plan to attend. You will walk away will skills that will make your next presentation more effective.
Not in the Toronto area? Click here for a curated list of resources on using Excel data in a PowerPoint presentation.
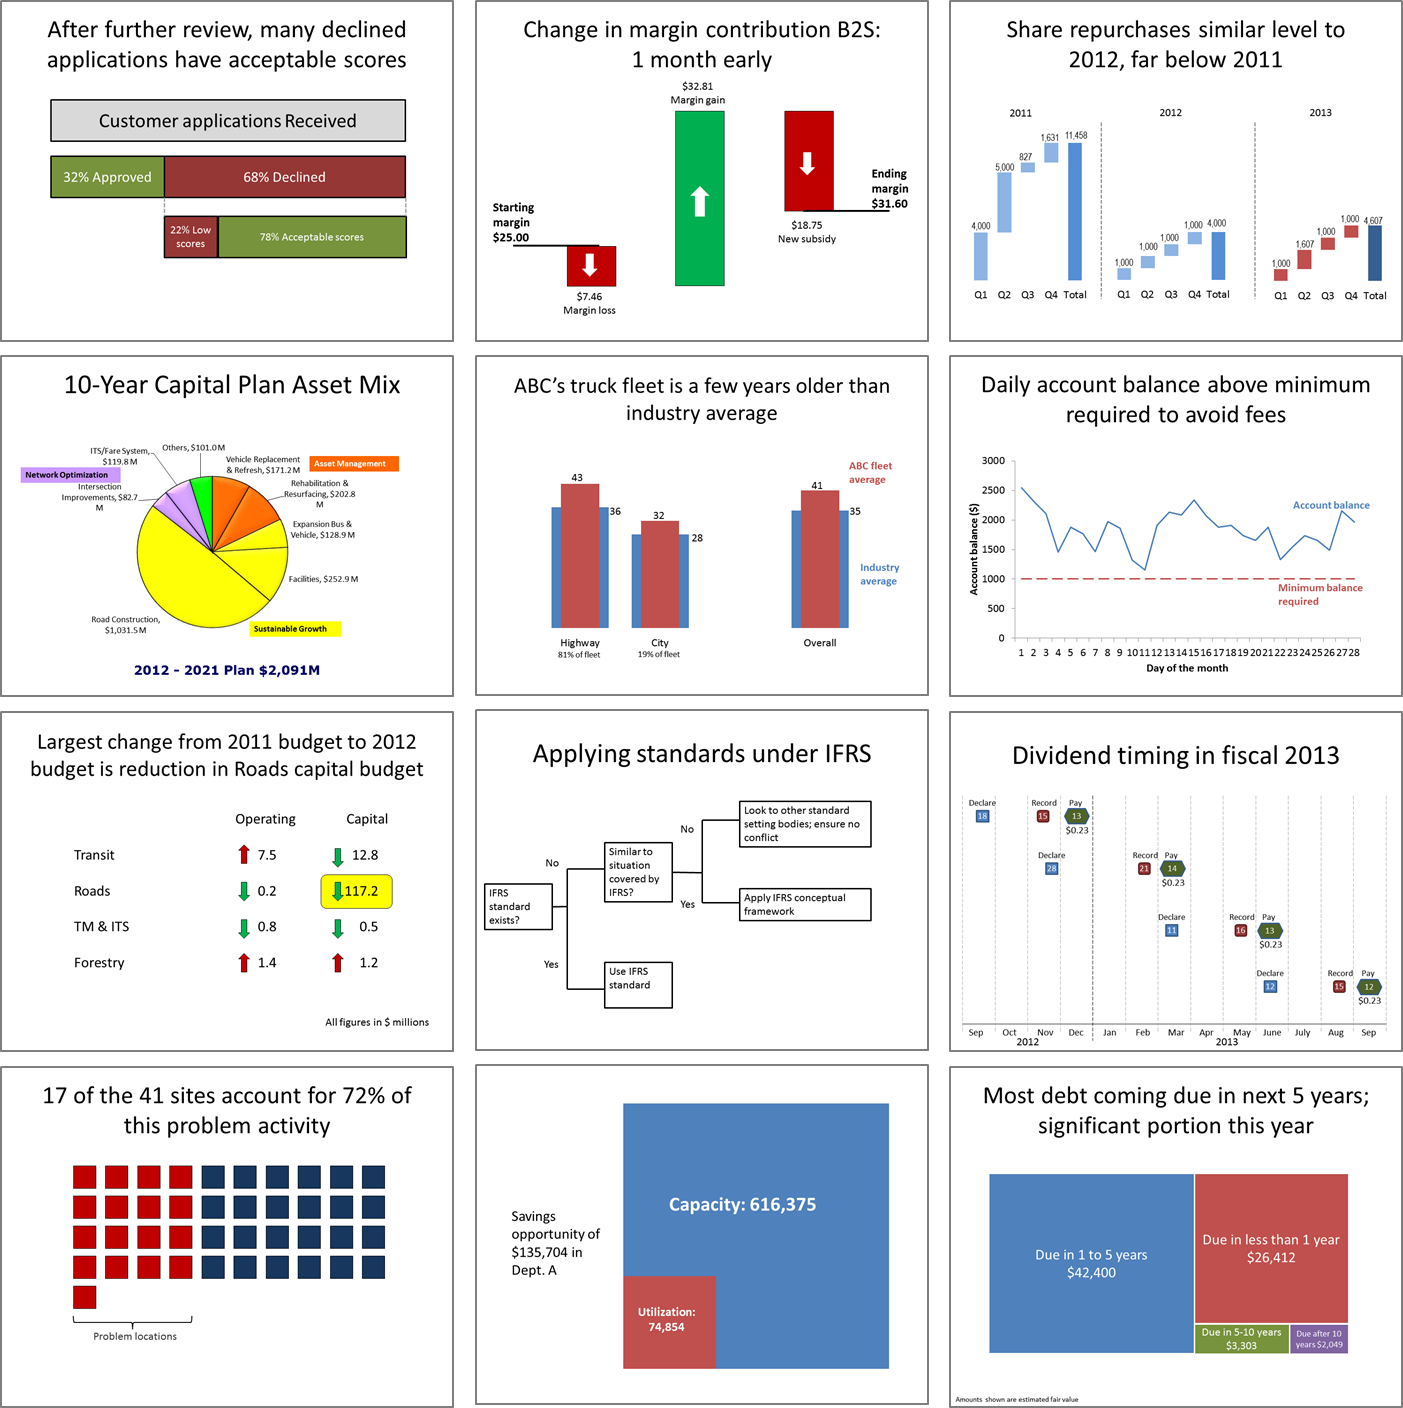
Here are some of the visuals you will learn how to create:
posted by Unknown at 2:19 PM
![]()

0 Comments:
Post a Comment
<< Home