Presentation Tip: Timeline Visuals
In a presentation where you have to share with the audience when some events happened or are planned to occur, don’t use a list of dates and descriptions. While accurate, a simple list does not help the audience to understand the time span involved and when the events occur within that timeframe. Instead, use a timeline visual. In this article I want to share some best practices for creating and using a timeline visual.
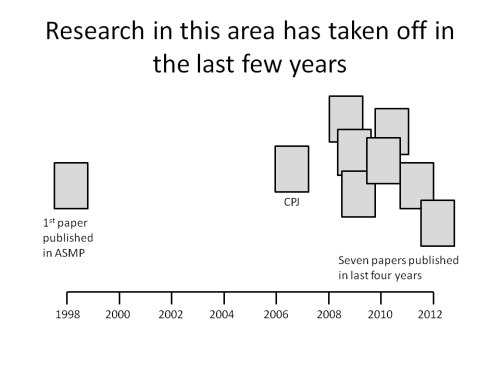
A timeline visual does not denote length of an event, like a Gantt chart does. It shows when each event will occur. The visual includes a timeline to indicate the entire span that is being discussed, and shapes that indicate when each event happens. Here is an example from a recent presentation showing when certain research papers were published on a particular topic.
The timeline should have marks to indicate the beginning and end of each time period, for example, each month. Typically the timeline will be a horizontal line with small vertical lines to indicate the separations. Make sure the marks are evenly spaced by using the Distribute function in PowerPoint and that there is text to indicate what time period each segment represents. If you need the audience to be able to see the divisions of the time segments across the whole slide, you can use dashed lines to separate the time segments instead of the small vertical lines. You have two choices as to where the timeline goes. Put the timeline at the top of the diagram if you want to focus on each time period and what occurred in that time period. Put the timeline at the bottom of the diagram if you want to focus on each event and when they happened.
You then use a shape to indicate each event. I find a simple shape such as a square, rectangle, circle, or diamond is easiest. Make it large enough so that the audience will be able to easily see it. Add any text inside or outside the shape to indicate the exact date/time the event occurs, or text that will identify the event.
When you are presenting the timeline visual, I suggest you build it item by item. Start by displaying the timeline and explain the context for the audience. Then add each item to the visual and explain why it is important, and any details about why it occurs at that time. If there are related items, you could display those together, such as showing all the events that occurred during a certain time period. Time based information is important in many presentations, and by using a timeline visual built with the best practices outlined above, your audience will be able to understand your message better.
posted by Unknown at 7:47 PM
![]()

0 Comments:
Post a Comment
<< Home